How to custom color value labels on a Pie Chart
Welcome to the custom coloring pie chart labels post! This isn’t hard to do, but the option is hidden just a little bit. Once you know where it is, you’ll use it all the time.
We’re going to use a simple Power BI file to get to know how to do this. If you’d like to use the same file, you can download it here.

Video Post:
Written Post:
Once you’ve set up a pie chart, and formatted it well, you may start looking at the data labels of your slices and think that it would be nice to set the colors of them to match the slices of your pie.
It IS possible, but the option is a little hidden. Unfortunately, Power BI visual formatting options are a little inconsistent, but I’ll help you out.
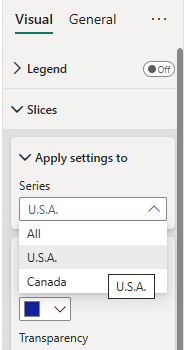
To adjust colors of our pie slices, we can go into the Visual Formatting options in our Visualization Pane, open up the Slices section, select the series we want to change the color of, and just pick a color. Easy-peasy.
Unfortunately, Microsoft has NOT extended this easy-peasy-ness to how to color data labels.
To make the match our Data Label colors to our slices, we need to go through a slightly different process.
We need to go into our Detail labels section and open up the Values options, but the option to select a series isn’t there. Thanks for nothing, Microsoft. It only gives us the option of selecting ONE color for all labels.
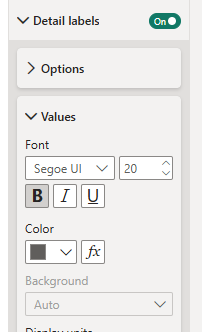
Instead, what we have to do to have our label colors match our slice colors is click that little fx button next to our color selector.
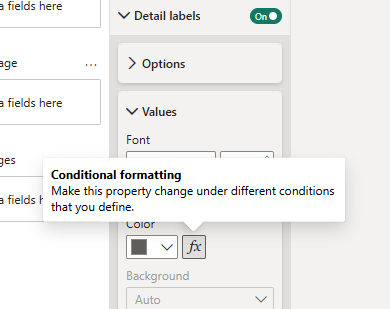
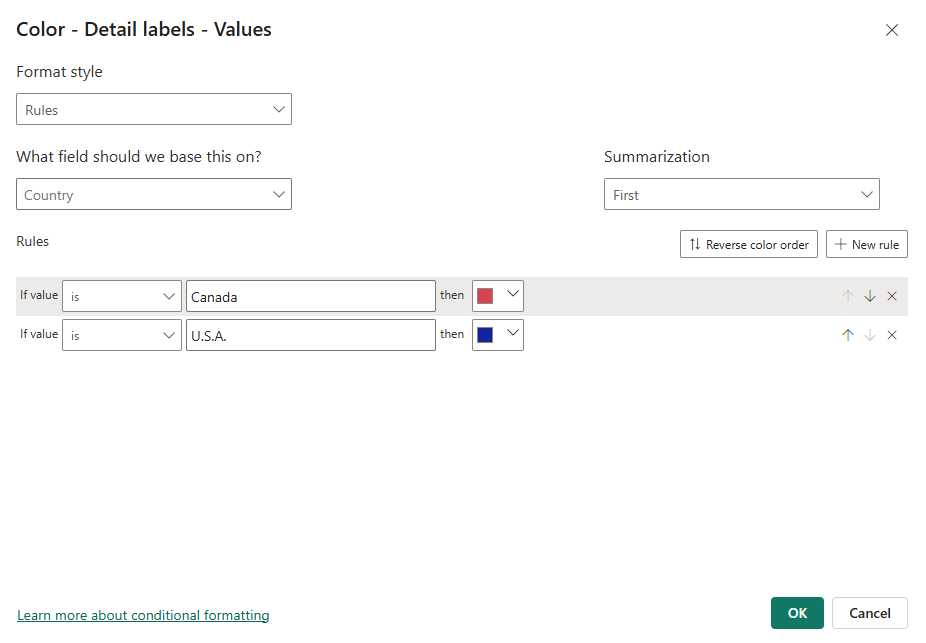
Clicking the fx button opens up a color formatting window. It looks a bit complicated the first time you see it, but we’ll go through it together.
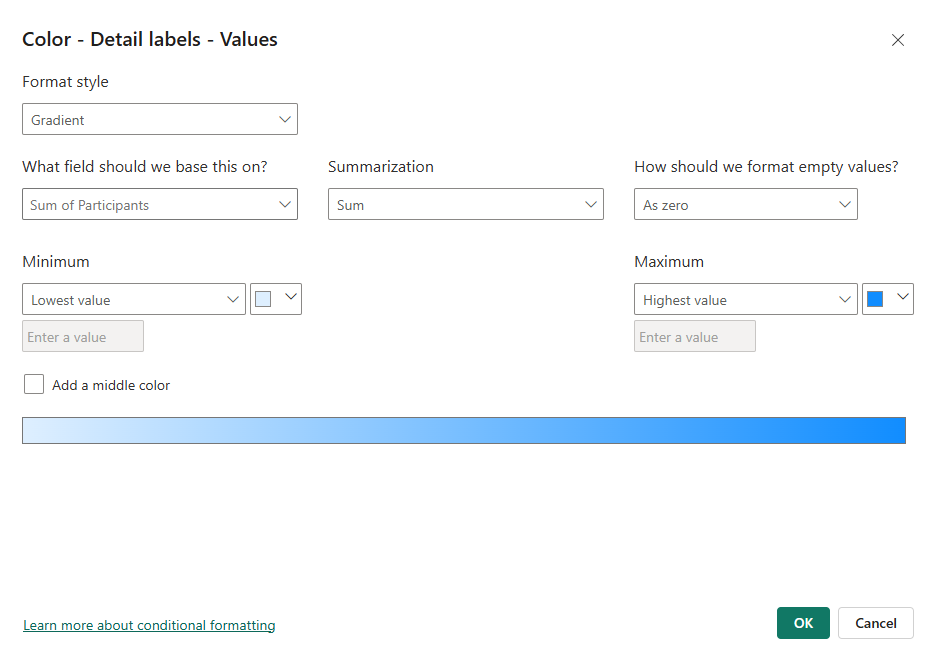
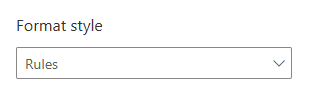
First, let’s set our Format Style to Rules.
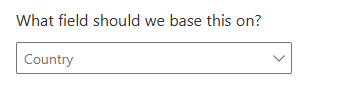
Then, we’re going to select Country in the ‘What field should we base this on?‘ dropdown, because the slices of our pie are our countries.
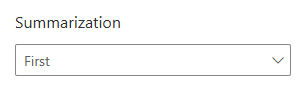
We can keep ‘Summarization‘ set to First.
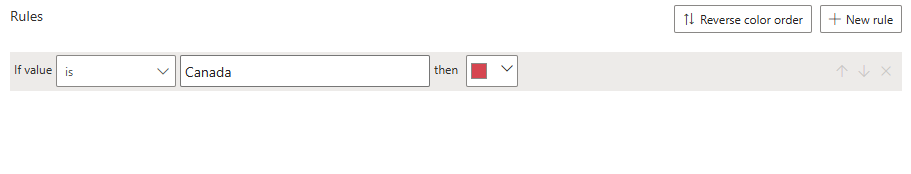
Then, we’re going to set up 2 rules that sets colors for each of our countries (the U.S. and Canada).
Here’s the first rule… if our Country field says Canada, we want the red color in our Label:
Then we’ll click the +New rule button on the right side to add another rule for the U.S.
Set up a rule for the U.S. now, and pay attention to how the U.S. is listed in your Country column. Is it listed as the U.S.? U.S.A? United States of America? America? Set up your rule accordingly.
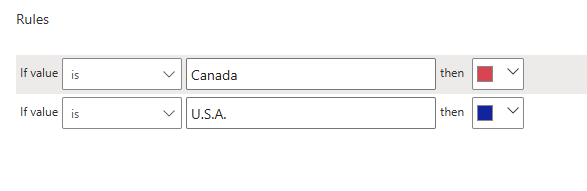
Your color rules window should look like this:
Now we can click the green OK button at the bottom to set this conditional formatting and apply it to our Pie Chart labels.
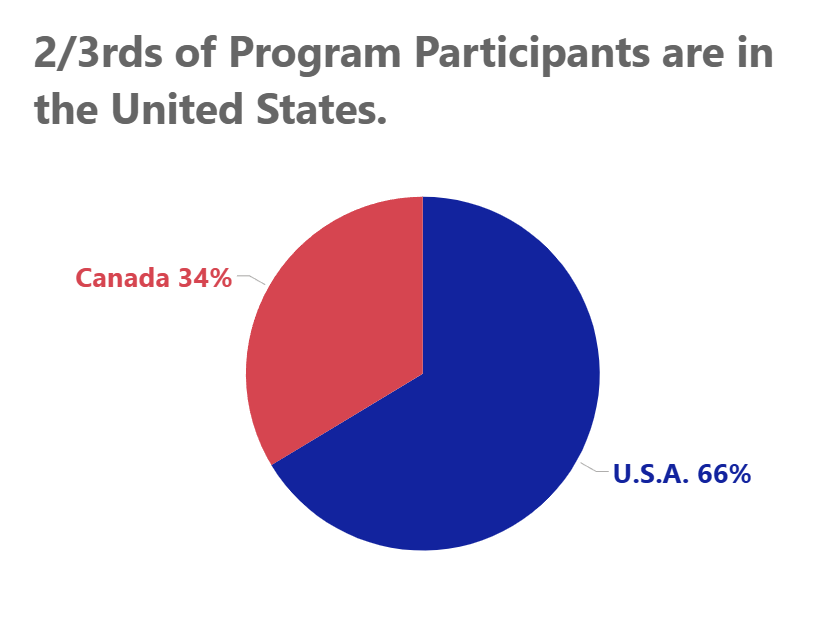
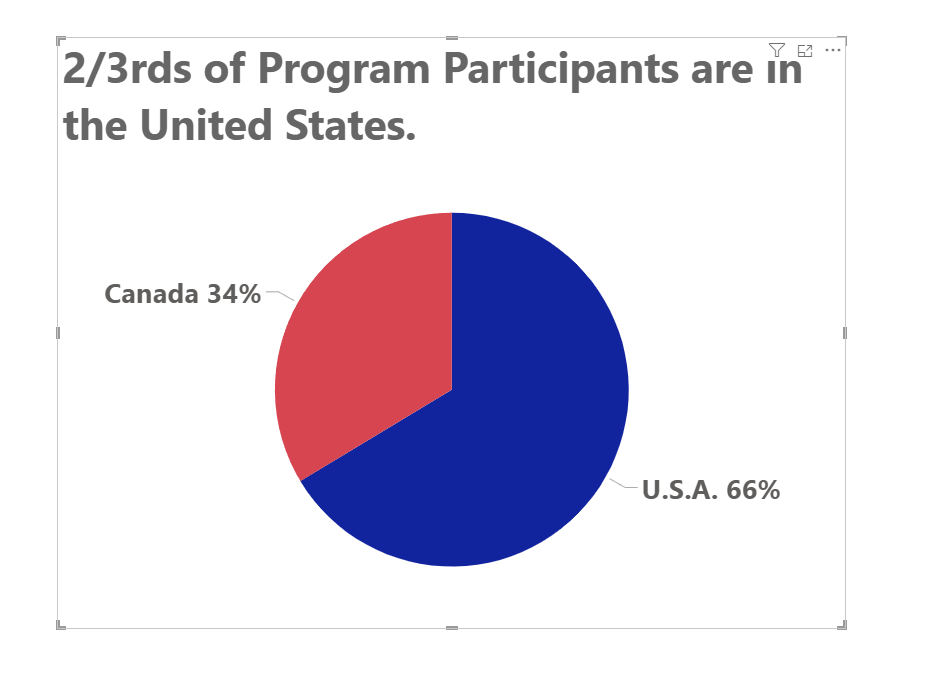
Now our label colors are the same as our pie slice colors.
Nice and easy (once you know the place Microsoft has hidden the option).
Take care everyone,
Joe.
More posts about Pie Charts:
More posts about Labels:
Like these posts but need more formal (but still engaging and fun) training in Power BI? Contact me, Joe Travers or at joe@traversdata.com. I got you.