How to get more Advanced with hiding/showing columns in a Table Visual.
Hi everyone,
Today we’re going to learn how to get more advanced with our Table visual column hiding (or showing).
This post is kind of a continuation from the previous How To Post about how to control column visibility. Click here to check that post out… there’s stuff in there you’ll need to know to make THIS post more useful.
Even though this post has “Advanced” in the title, this is still going to be super EASY (which is what I aim for in EVERY post, of course).
We’re going to use a simple Power BI file to get to know how to do this. If you’d like to use the same file, you can download it here:

Video Post:
Written Post:
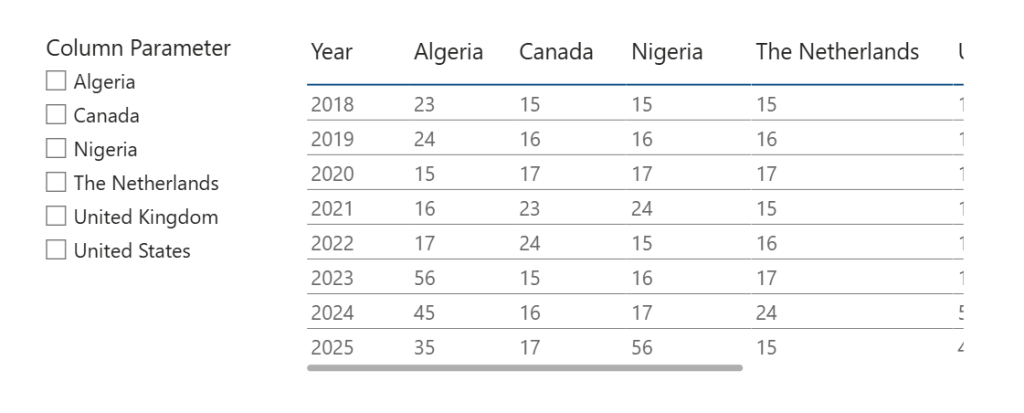
We again have a simple report with a simple table built. We’ve also got a slicer built with a Field Parameter that allows us to show or hide columns in our table. You can learn how to do this in the post I mentioned above: How to Hide/Show columns in a Table Visual.
Now, let’s level this up with some more functionality.
We can totally have a Field Parameter slicer like we do here, that can allow our audience to show/hide columns just like in our previous post about this, but what if you have a ton of columns and you don’t have to make your viewers do an annoying ton of clicking to get the fields they want?
What if this table wasn’t just showing 6 country columns, but 60? Or more? It would be a pain in the ass for them to go through a giant list to select countries from a certain continent, or some other grouping.
So, as with everything in *good* Power BI design, we make our report *EASIER* for our viewers.
Let’s learn how to group these countries into Continents (because it may not be in your data) to see how this can make our Table easier.
First, we’re going to make a new column in our Column Parameter table (which in turn was created when we made our Parameter) by right-clicking on our Column Parameter table in our Data Pane and selecting new column.
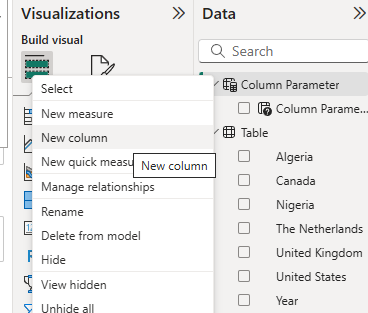
We’re going to make a new column that groups the country columns in our Parameter into Continents.
We could use some nested IF statements to make this work (as in IF it’s Canada, group it with North America, etc) but we’re going to use something a bit different. A SWITCH function.
A SWITCH function checks a column or a measure for different things, and depending on what it finds, returns different values.
Let’s try it out.
Here is our DAX for this new column:
CONTINENTS =
SWITCH('Column Parameter'[Column Parameter],
    "Algeria", "Africa",
    "Canada", "North America",
    "Nigeria", "Africa",
    "The Netherlands", "Europe",
    "United Kingdom", "Europe",
    "United States", "North America"
)
That first line tells Power BI to look at the Column Parameter column, and then after that it’s a series of IF, THEN statements. IF it says “Algeria” then the column will say “Africa”. IF it says “Canada” then the column will say “North America”.
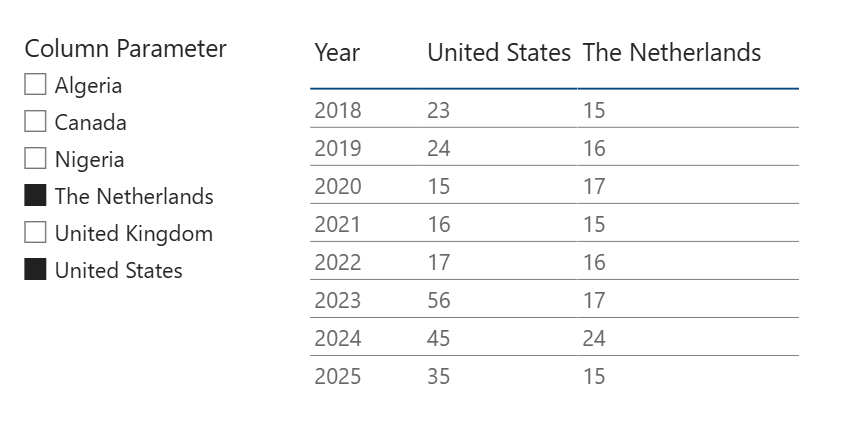
Now we can replace the Parameter column in our slicer with our new Continents column and we get a slicer with continents, allowing our users to show or hide different groups (in this case continents) of countries SUPER easily.
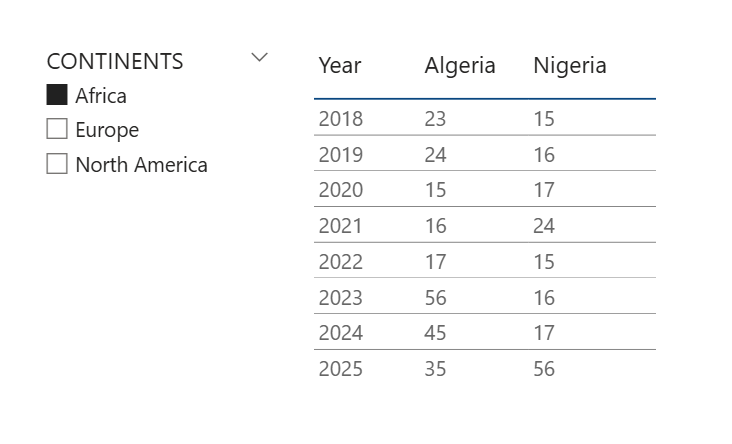
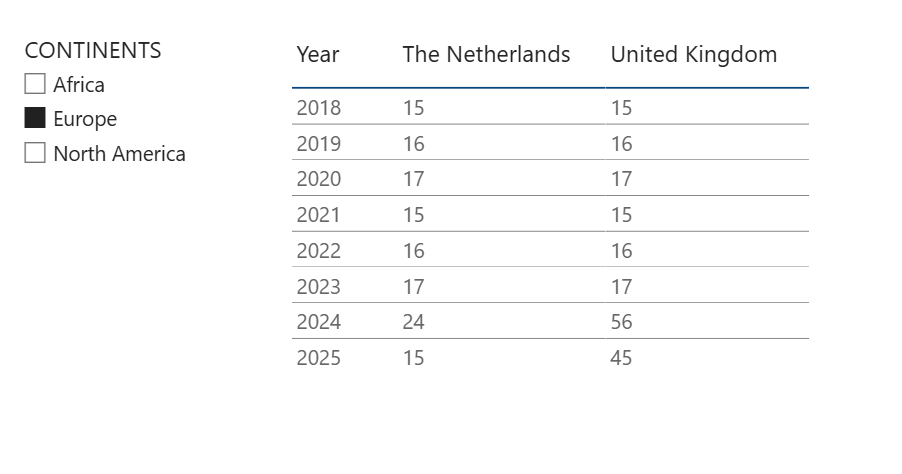
That’s it! SUPER easy, yet super effective, and will make a world of difference to your users if you have to give them a big Table visual.
Make it EASY for them.
Take care,
Joe.
More posts about other Tables:
More posts about Parameters:
Like these posts but need more formal (but still engaging and fun) training in Power BI? Contact me, Joe Travers or at joe@traversdata.com. I got you.