How to get Power BI to display zeroes.

Welcome everyone!
This post is about how to fix one of the annoying things in Power BI that makes you say “What The…?” (or worse language) when it happens.
Sometimes, when you get Power BI to do a calculation (a sum, a count, a division… lots of things) and it finds no answer, it puts a blank in place of a number. Technically, it’s correct… the absence of a number *IS* no number, but if we want our Power BI reports to be People-Friendly (spoiler: you totally do), most of the time you’re going to want to show the number 0 to indicate to your report audience that the calculation was done, and nothing was found.
People understand zeroes.
They do NOT understand blanks. Blanks are misinterpreted as errors, as bad data, as something you did wrong.
Power BI ignores the very definition of what a zero is (which, according to wikipedia, is “0 (zero) is a number representing an empty quantity. “
Zero literally means the absence of a number, but Power BI doesn’t understand this in some cases.
We’re going to use a very simple dataset to demonstrate how to FIX this confusing “What The….?” situation, and if you’d like a copy of the Power BI file I use in the below video and written instructions, you can download it here:

Cool. You’re good to go. Let’s do the video and written tutorials now.
Video Post:
Written Post:
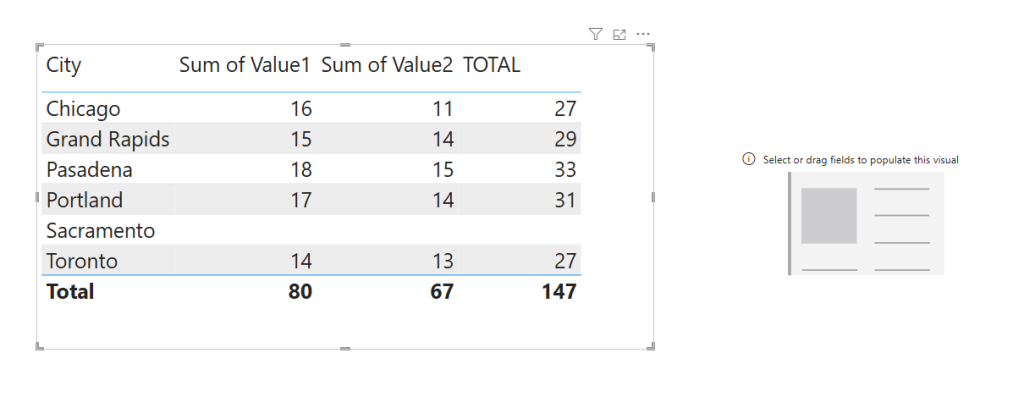
We’re starting with a Power BI report with just a small simple dataset connected.
We have a table here that shows our data. A City column as well as two Value columns with numbers. We have 6 cities showing the number of occurrences of something… but the Sacramento row is blank. This could be because there have been no occurrences of whatever this is counting in Sacramento yet, so there’s a lack of data. No data means no numbers, not even 0s.
It also has a card visual in the lower right that’s empty right now. Don’t worry, we’ll use that to show how Power BI has issues with zeros and how to fix it.
To demonstrate how Power BI has issues with zeroes, let’s suppose we need to total our Value columns together to get an overall total that we’ll use in a visual. We’ll use a SUM calculation for this This zero issue also comes up in DIVIDE calculations, COUNT calculations, even CALCULATE calculations… the fix is always the same.
Create a new DAX measure by clicking the “New Measure” button up in the ribbon at the top of the screen, and use this DAX:
TOTAL =
SUM('Table'[Value1]) + SUM('Table'[Value2])
So we’ve just added these two values together. Let’s add our new measure to our Table to see what happens.
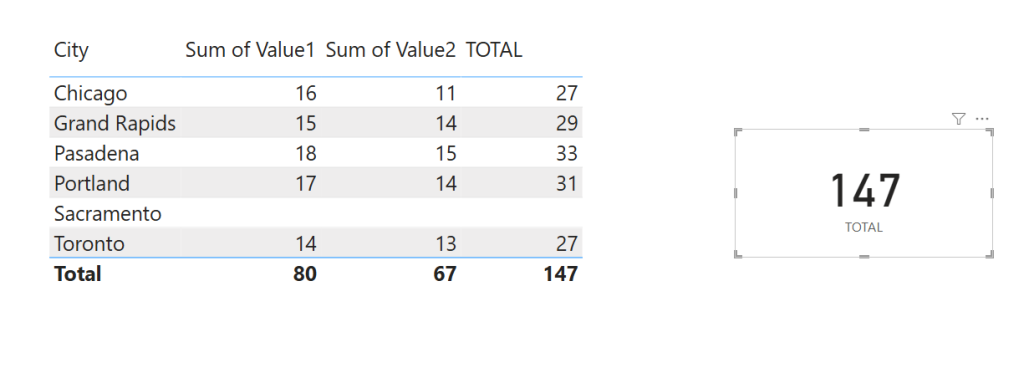
We get a blank for Sacramento too, which makes sense… but if we’re using these TOTAL numbers in a chart, we’d actually probably want Sacramento to be represented by a 0… especially if we expect numbers to occur in Sacramento. They may just not have happened yet.
For instance, if this was counting car sales, those Sacramento blanks may represent that there have been no sales in Sacramento yet, but as soon as Sacramento sells a car, we’ll start getting numbers. LOTS of dynamic data sources work like this, having blanks instead of zeroes.
Our new measure doesn’t show a zero, but it’s actually a bigger problem as well. If we add our TOTAL measure to our Data Card visual, we’ll get the sum of all our TOTAL numbers, which is 147.
However, if we click on the Sacramento row in our table, that card gets filtered to show just Sacramento data, and we don’t get a visual blank… we get TEXT that says (Blank).
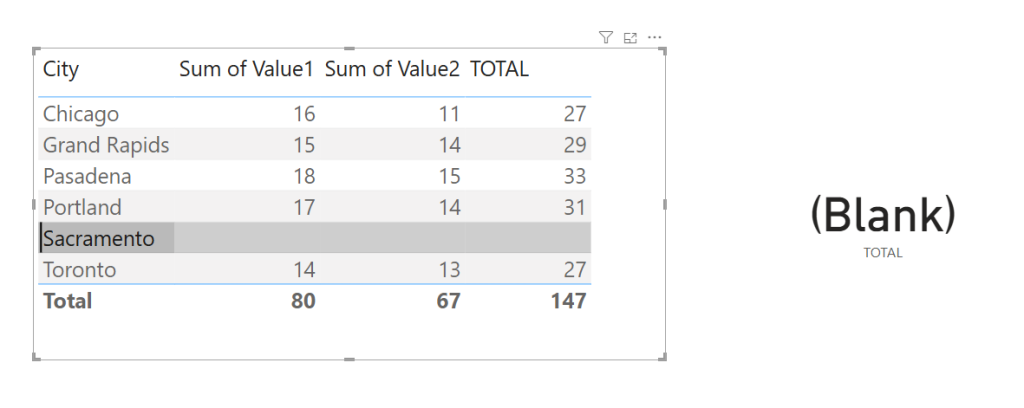
It’s not great, and makes a report look kinda shoddy if “(Blank)”s start showing up everywhere. They look like errors.
So, to fix this, we have to help Power BI a bit.
Power BI already *knows* our calculation is a number, but it can’t figure out that the absence of a number is zero.
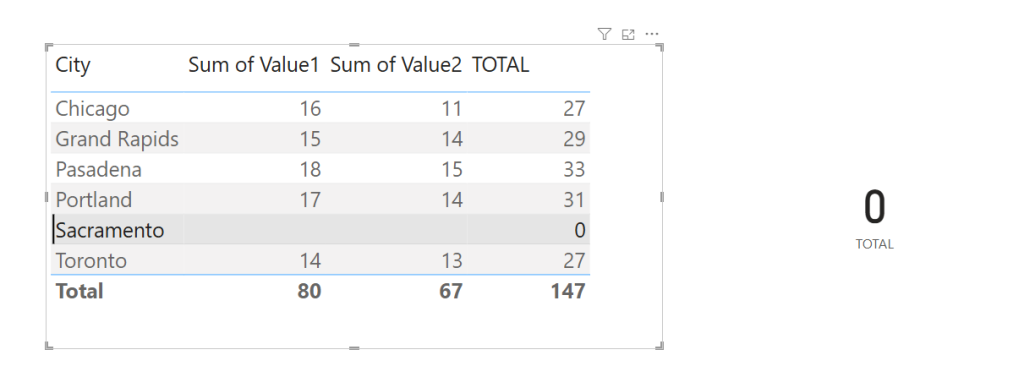
We’re going to tell it to show a blank as zero by (weirdly, annoyingly) adding 0 to our calculation.
Like this:
TOTAL =
SUM('Table'[Value1]) + SUM('Table'[Value2]) + 0
Do that one simple thing (no matter what type of calculation you are doing), and get a zero.
You’ll see this issue come up again and again when building reports, and it’s totally annoying, but now you know how to fix it. Easily.
Take care everyone,
Joe.
Like these posts but need more formal (but still engaging and fun) training in Power BI? Contact me, Joe Travers or at joe@traversdata.com. I got you.
