How to Hide/Show columns in a Table Visual
Today on How To Use Power BI we’re going to learn a really simple solution to a really common conundrum in the Power BI Table visual.
If you spend any time on a Power BI forum / subreddit / whatever, you’ll eventually (or frequently) see someone asking the question about how to hide/show columns in a table visual. Sometimes these tables can get large and unwieldy and it would be great if we could let our viewer *choose* which columns showed up, depending on what they want to see.
There are a few ways to make this happen in a table visual, and almost every solution to this question is TOO COMPLICATED.
So, this post is going to show you an EASY way to make columns in a table visual visible (or invisible), and then next week (be sure and tune in next week) I’ll show you how to level up this technique a bit.
We’re going to use a simple Power BI file to get to know how to do this. If you’d like to use the same file, you can download it here:

Video Post:
Written Post:
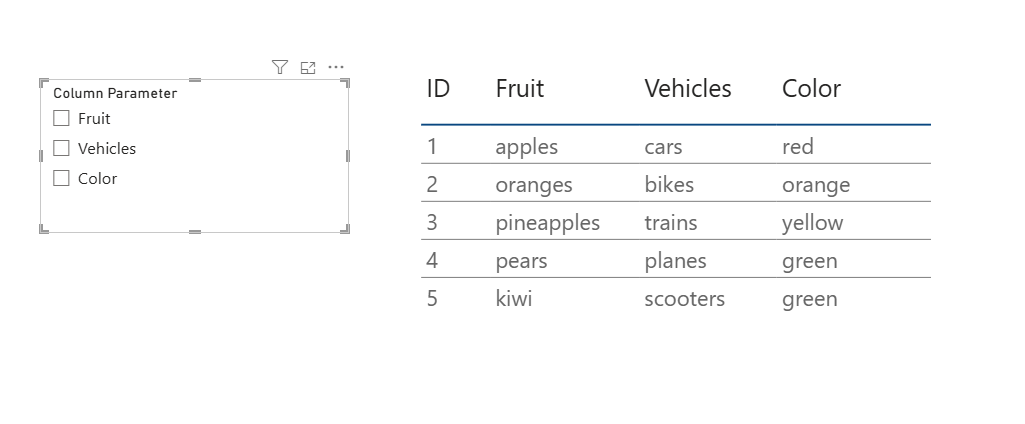
We have here a really simple Power BI report with a super simple table visual built on it (and I have formatted it a bit so we’re not stuck with the horrible default table Power BI gives us).
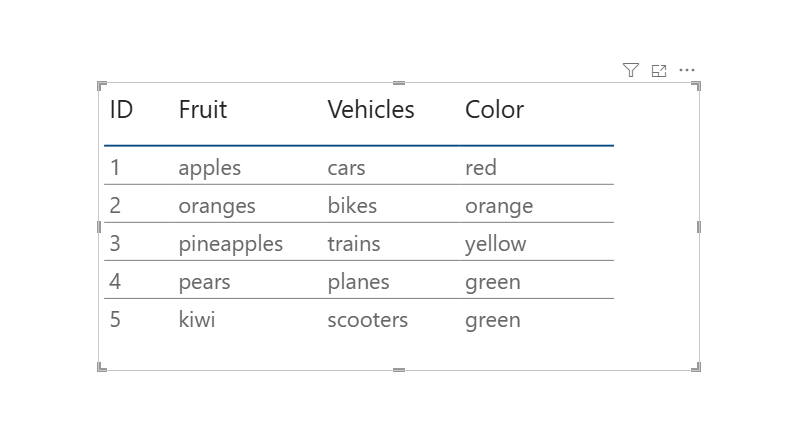
It’s a simple table with an ID row and 3 columns with things in them, namely Fruit, Vehicles, and Colors. This isn’t real data, just data I threw in here to show you the mechanics of how to make the visibility of each of these optional.
I mentioned it above but here it is again… doing a google search of how to make columns in a Table visual visible (or invisible) on command will give you a lot of very complicated methods to do this.
I want you to know an EASY way to do this.
The easy way to do this is to use something called a Field Parameter. Let’s set one up together.
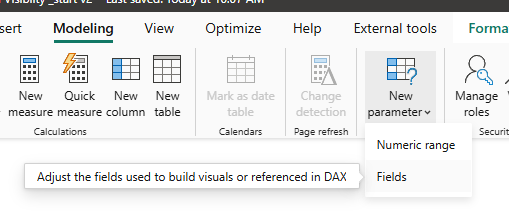
First, we’re going to click the Modelling tab up at the top of Power BI Desktop, and then click the button that says New Parameter, and then choose the Fields option.
This opens up a Parameters window where we can tell Power BI what fields we want our Parameter to have.
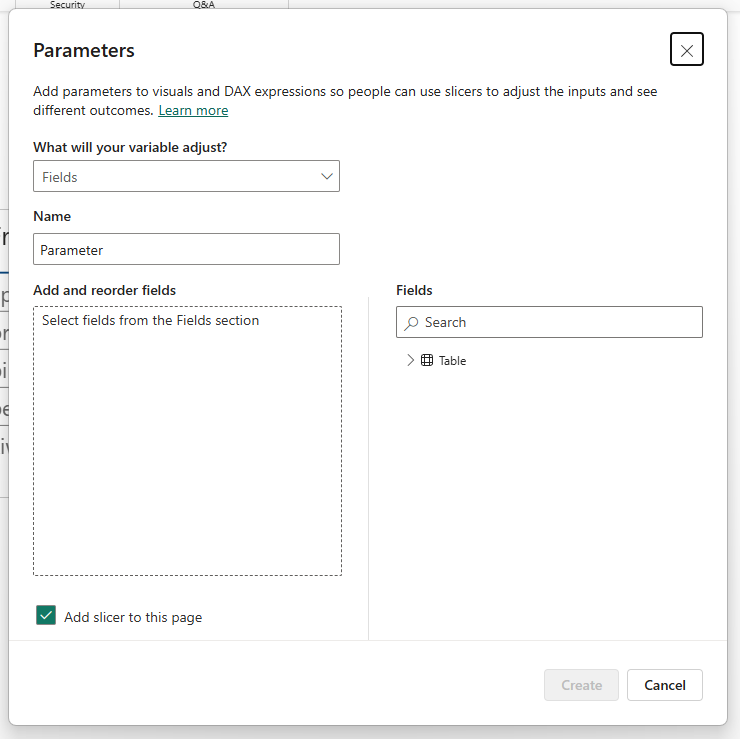
First, we’ll keep the first dropdown entitled “What will your variable adjust?” as is and keep it set to Fields.
Then we can name it. Let’s call this one “Column Parameter”.
Now we choose what fields we want in this parameter. we want our Fruit, Vehicles, and Color columns so we’ll click those 3 in the Fields section at the lower right and they’ll get added to the left side.
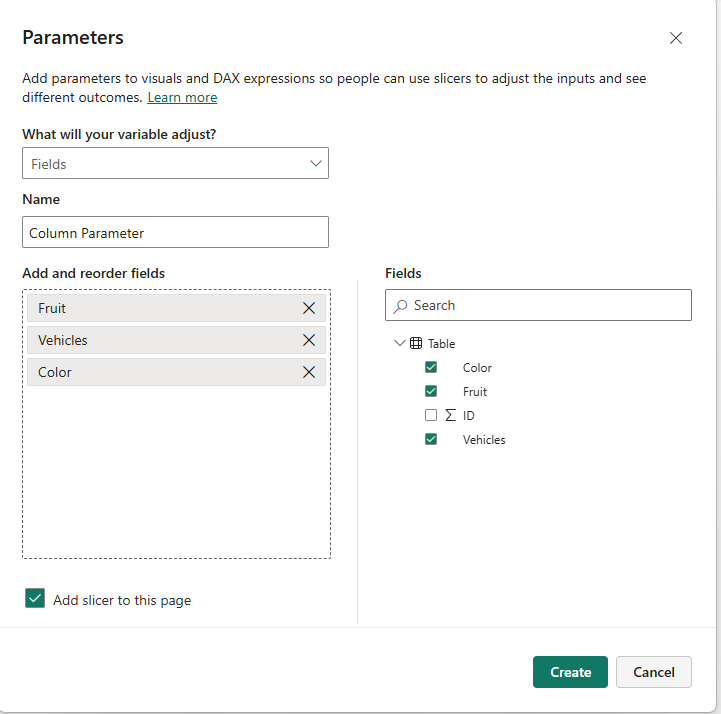
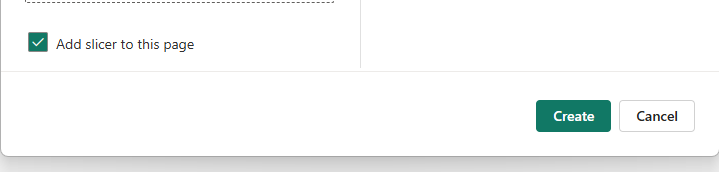
To finish, we’re going to make sure the Add slicer to this page checkbox is checked and then click the Create button.
This gives us a new slicer with the names of our 3 columns, and it doesn’t look like anything else has changed…. but in Power BI, nothing being selected on a slicer means EVERYTHING is selected (yeah, I know, it’s weird.)
Test out your Parameter slicer by clicking a couple of those column checkboxes.
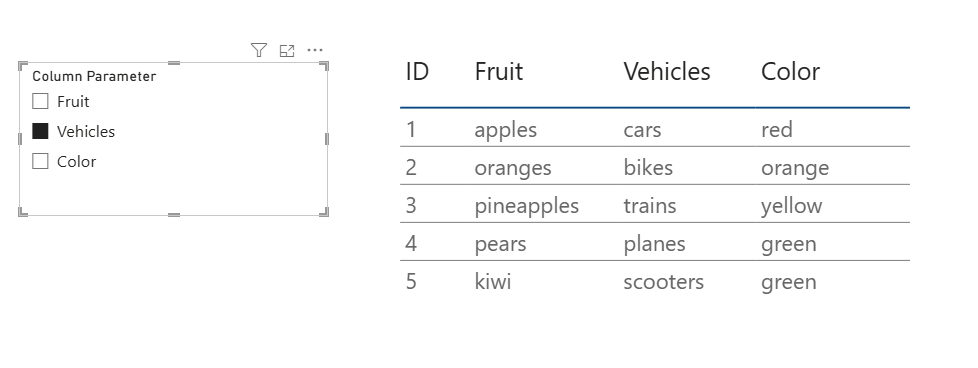
Still nothing, right?
Don’t worry… you didn’t do anything wrong. There’s one more step we have to do.
We have to adjust what’s in our table. Right now the 3 columns are in there. We’ll take those out and add in the column a Parameter column that was created when we made our Parameter. You’ll find a new data table in your Data Pane, and a column in there.
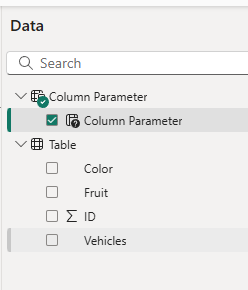
Drag that new column to your table (or the Columns box on the Visualization Pane) to add it to your table.
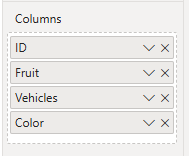
Your original table has these fields:
Your new table takes out everything but the ID field and puts in the new Column Parameter field.
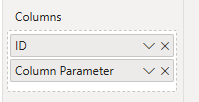
Your table will look exactly the same, but now those fields are all part of that Parameter, rather than added individually.
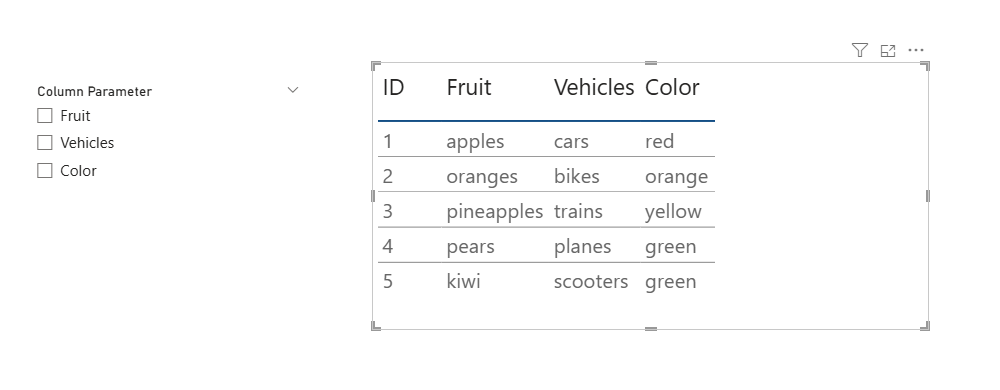
NOW click items in the Parameter slicer. (hold the CTRL key to select more than one)
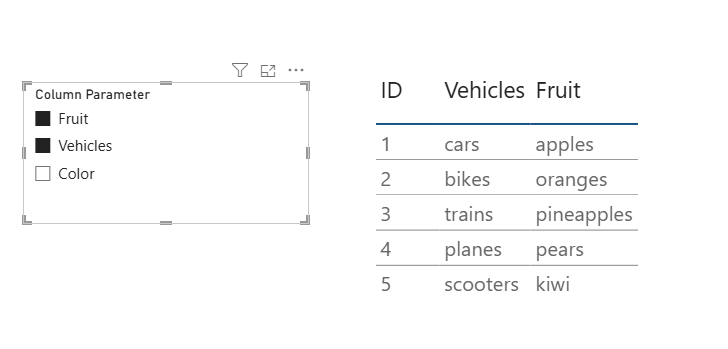
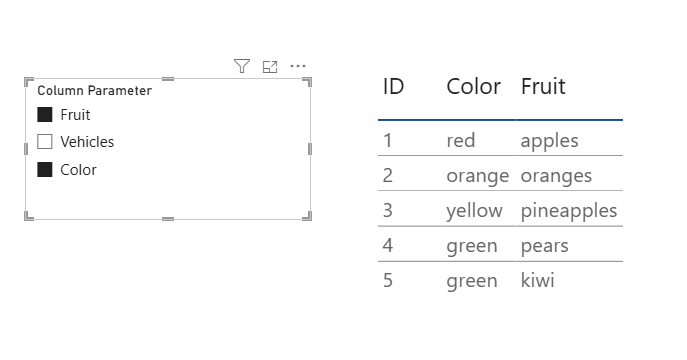
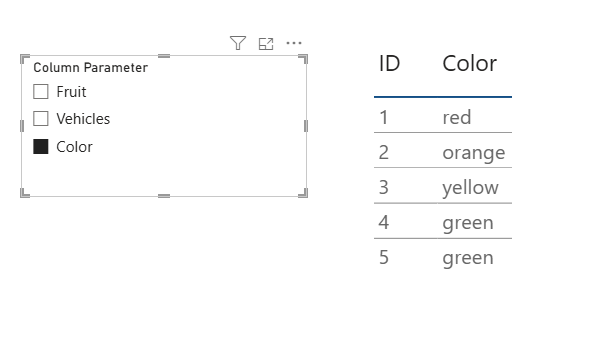
The parameter slicer lets your viewer choose what’s visible in the table!
Pretty cool, right? Nice and easy too!
EDIT: Learn how to take this to the next level with a simple bit of DAX. You’ll love it.
Take care everyone,
Joe.
More posts about other Visuals:
More posts about the User Interface:
Like these posts but need more formal (but still engaging and fun) training in Power BI? Contact me, Joe Travers or at joe@traversdata.com. I got you.

Contact Joe | TraversData.com | People-Friendly Power BI | LinkedIn