How to search formatting options in Power BI
Welcome to the searching formatting options post on How To Use Power BI.
We’re going to look at a really simple and useful formatting feature that even I forget about, even though I’ve used Power BI almost every day for years and years and years.
Maybe *I* am the only person that overlooks this feature… there are SO many formatting options that I forget it’s there.
We’re going to use a simple Power BI file to get to know this feature. If you’d like to use the same file, you can download it here:

Video Post:
Written Post:
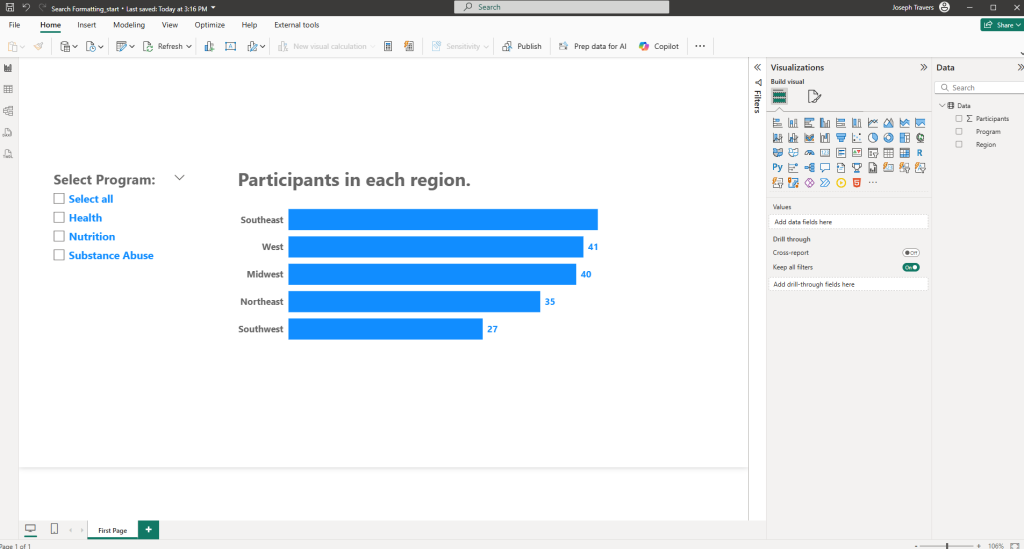
We’re starting off with just a simple Power BI file that has a bar chart and a slicer. That’s it.
When we need to format something in our Power BI visuals, we click on a visual, and that visual is then selected (indicated by a grey box appearing around it) and visual formatting options appear in the Visualization Pane… indicated with the icon of a column chart with a paintbrush.
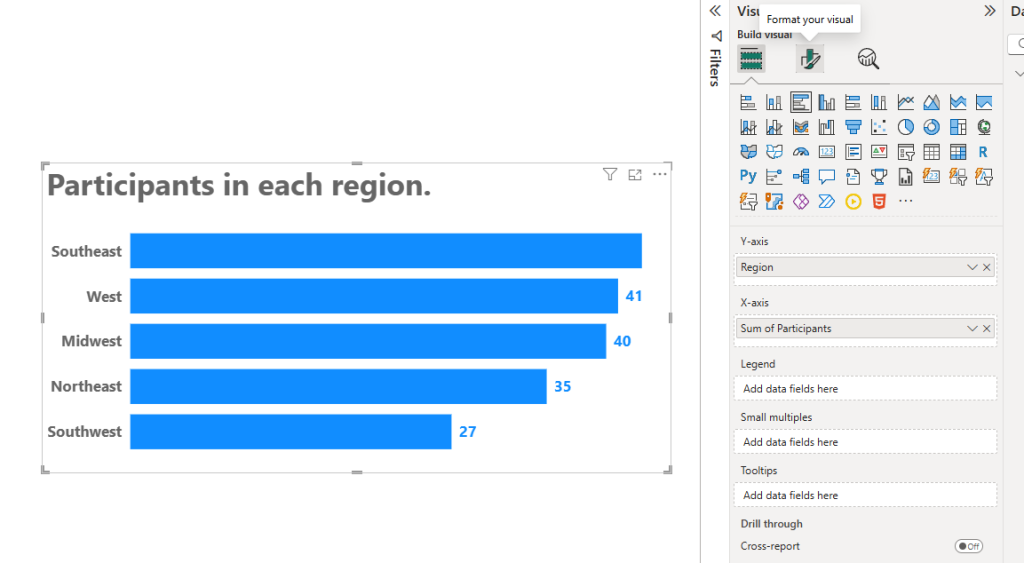
Clicking into those Formatting options gives you a TON of options, both in Visual Formatting and General Formatting, and it can be difficult to find certain options.
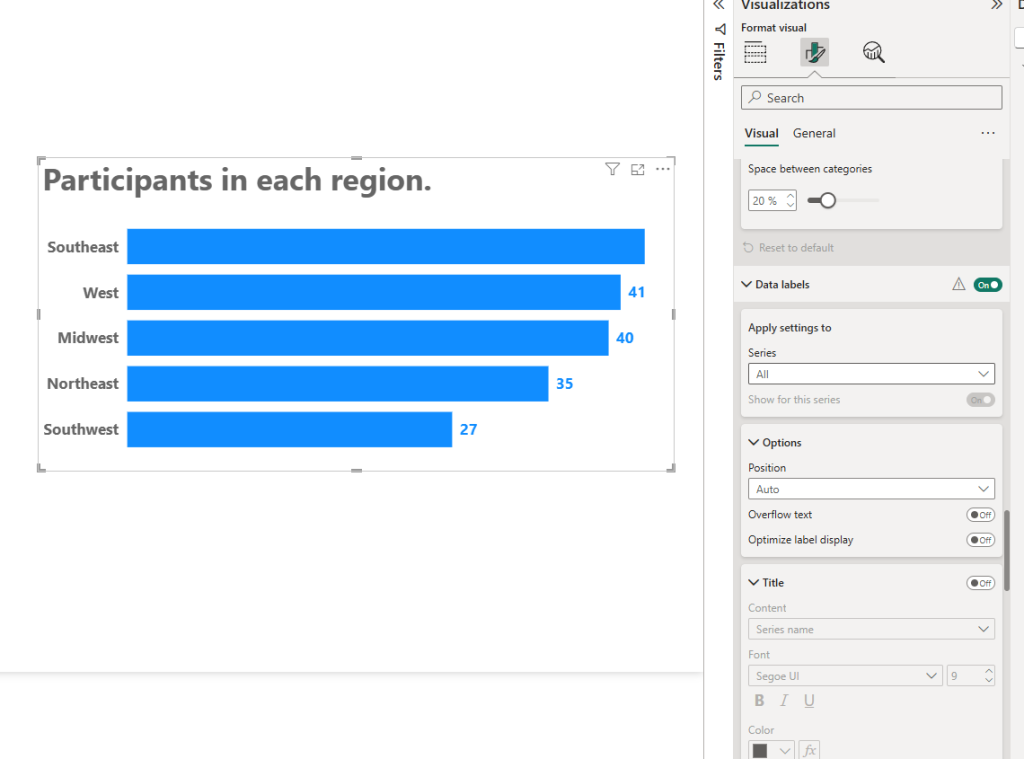
Helpfully, and this is the part I always forget exists, is there is a search bar at the top of the Visualization Pane that will help you search for things.
(My excuse for not seeing it, both now and in my early days of using Power BI, was that I was overwhelmed with all the other formatting options).
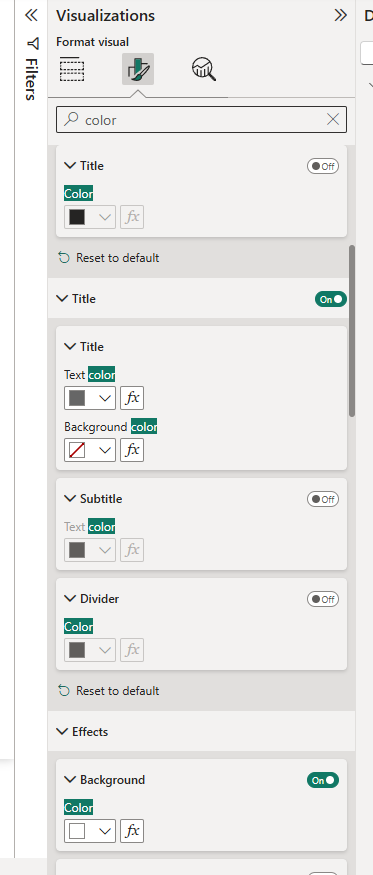
So, if you are searching for a color formatting option, you can type “color” into that search bar, and it will bring up all the formatting options that have the word color in them.
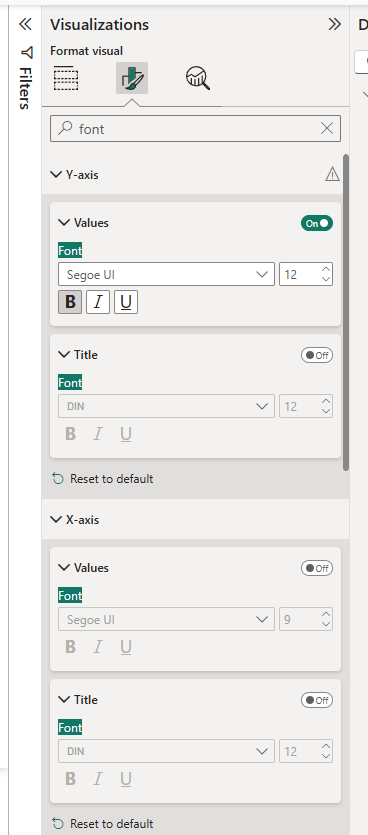
Or, if you need to find a Font setting, you can type in Font:
So this is pretty handy, but there *are* times when this search function doesn’t work the best, like when a formatting feature is named something unexpected.
The Line and Area chart visuals have something like this… and we totally don’t have the right data for a line chart here, but let’s build one quickly just so I can show you how the Search can fail.
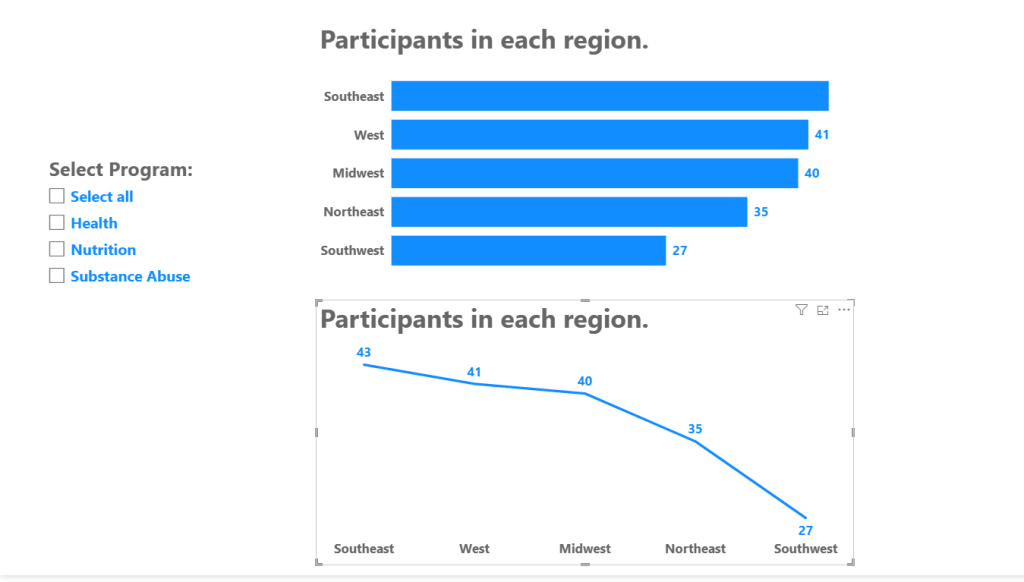
I’ve made a duplicate of our Bar chart and switched it to a Line Chart by clicking the Line Chart icon in the Visualizations pane while it was selected.
Again, this is NOT the right data for a Line Chart, which are for showing data over time, so the ONLY way this would be the right chart was if there was a travelling event and it stopped in each region and you wanted to show the number of visitors as time progressed.
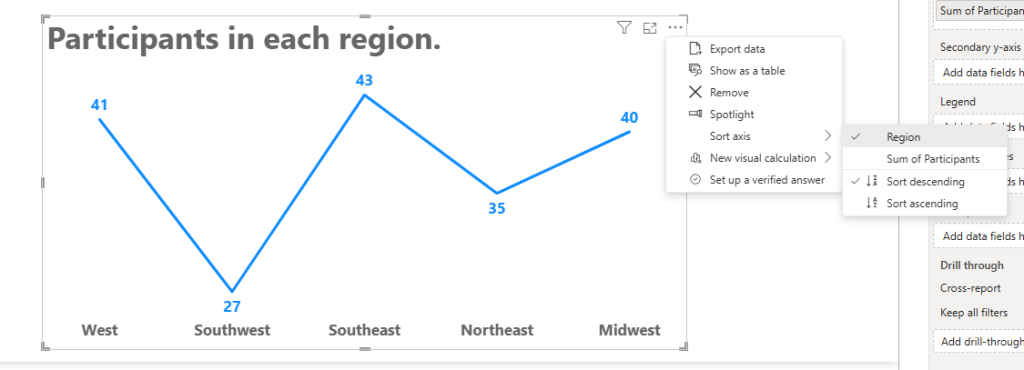
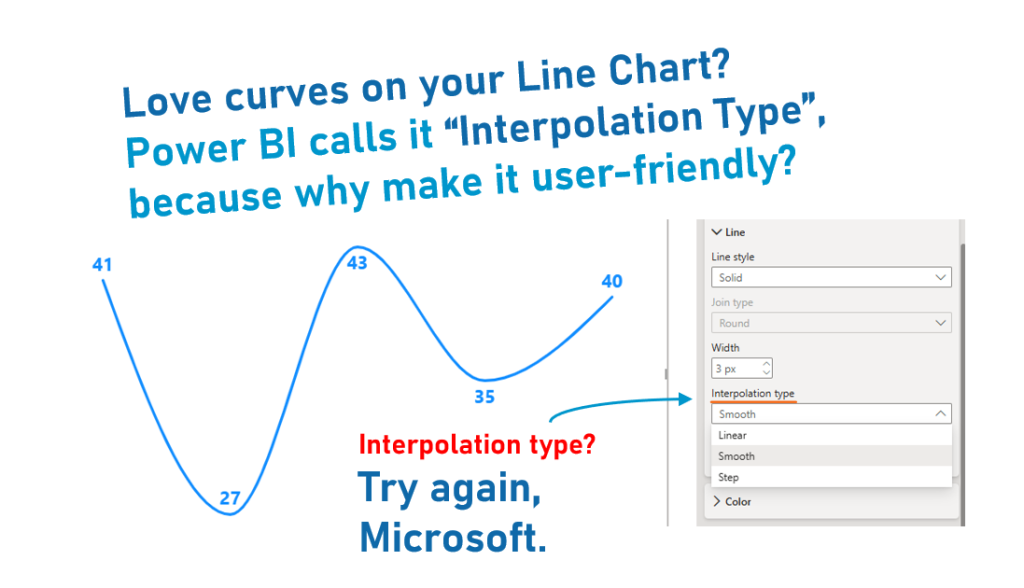
Line and Area charts have a fun feature that allows you to smooth out a line (or make it curvy instead of jagged). I’m going to sort our line chart by Region so we can show how jagged this can be.
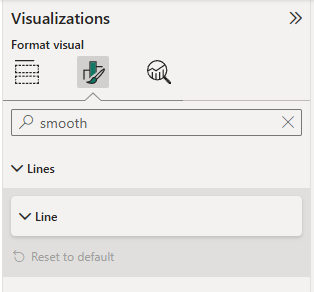
Okay, let’s try and search for the formatting feature where we can smooth out this line.
We can search for Smooth, and get close to nothing… it gives us “Line” formatting, but we can’t open it up.
We can search for Curve, and still get nothing.
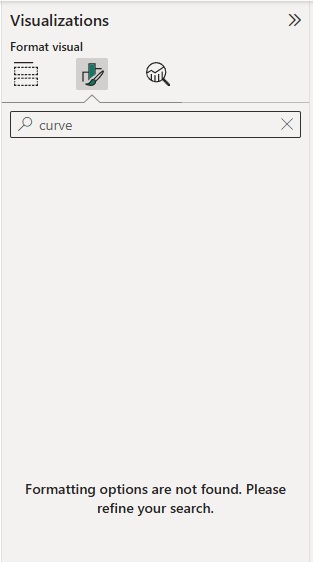
We can’t find anything because Power BI developers named this feature something very technical.
It’s called Interpolation Type, and it in the main Line formatting section:
So, the search function IS useful, but only when you know exactly what you are looking for and what it’s named.
Take care everyone,
Joe.
More posts about other Formatting:
More posts about the User Interface:
Like these posts but need more formal (but still engaging and fun) training in Power BI? Contact me, Joe Travers or at joe@traversdata.com. I got you.

Contact Joe | TraversData.com | People-Friendly Power BI | LinkedIn