Power BI DAX: MAX

Hey everyone,
This post is all about the MAX function in DAX, which does exactly what you think it does… it finds the maximum value in a column of values.
We’re going to use a very simple Power BI report (in both the video and the written post below) to demonstrate how MAX works, and if you’d like a copy of this file you can download it by clicking here (or click the graphic below).

Video Instructions:
Written Instructions:
The Power BI report we’re using to show how MAX works is nice and easy. We have one very small dataset with data about coffee (can you tell I’m writing this all caffeinated up in a coffee shop?) and I’ve made a basic bar chart as well as a table using the same data.
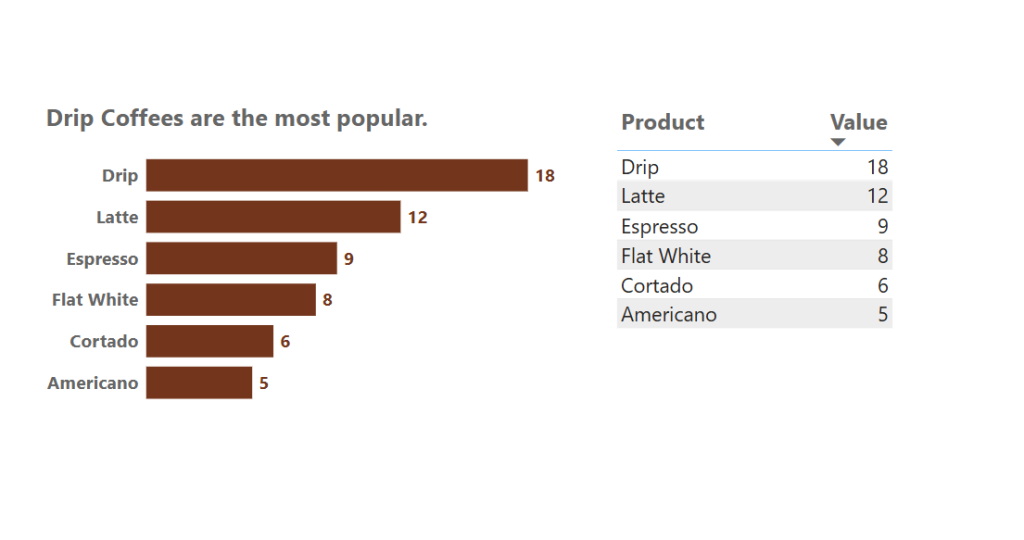
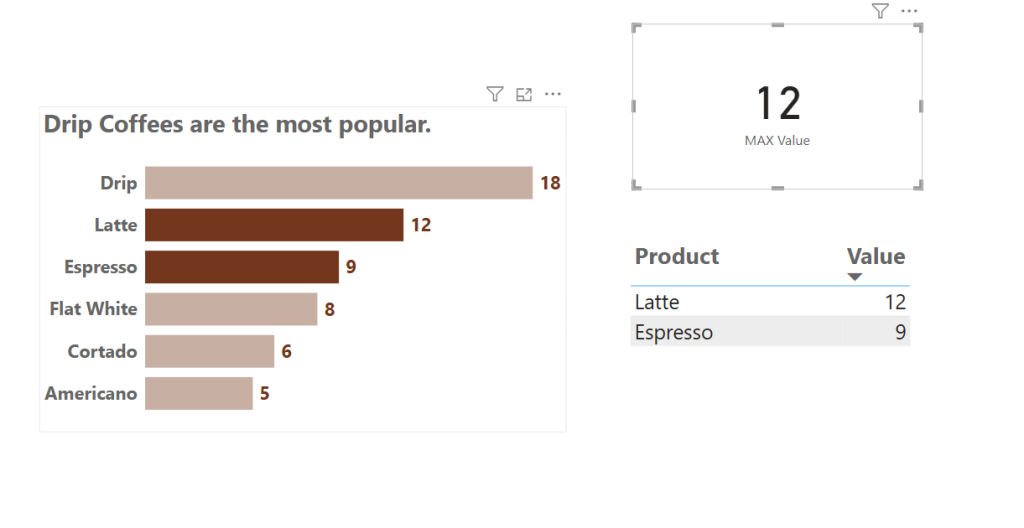
Now, it’s fairly evident from both our bar chart and our table that Drip Coffee has the highest value. We can see that 18 is the highest value in our data, but sometimes we need to isolate that value. Maybe we need it for another DAX calculation, or maybe we just want to show it somewhere in our report.
Here’s how we do that.
We’re going to create a measure, so click the New Measure button up in the Ribbon.

In the formula bar that shows up at the top of the canvas, we’re going to type in:
MAX Value = MAX(Coffee[Value])The MAX tells Power BI that we want the maximum value in a column, and then we tell it what column to look in by listing the table name first (named ‘Coffee’ in this case) and then the column name in square brackets.
This gives us a new measure in our Data Pane, and we can check to make sure it’s working by dragging this measure into a Data Card on our canvas.
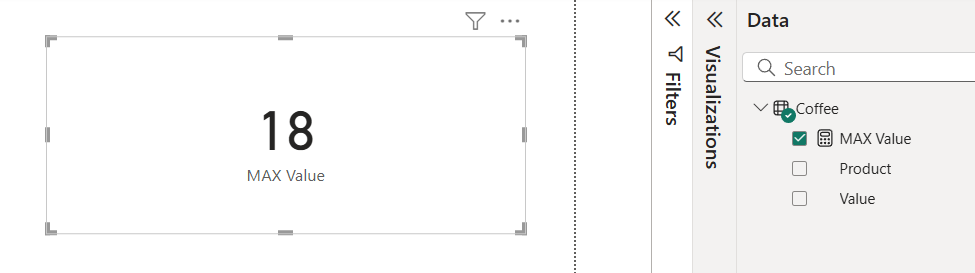
Cool. It’s working exactly as it should.
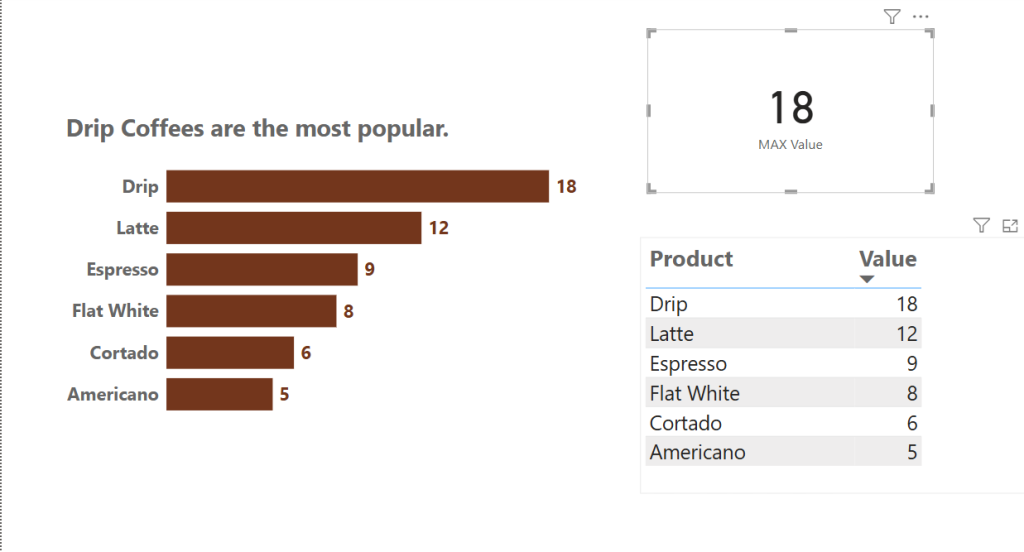
Our MAX value will interact and calculate in coordination with other elements on our page too.
If we click the Espresso bar on our bar chart, not only is our table filtered to only show the Espressos, but our MAX measure is as well. It is now figuring out the MAX of only the Espresso row of data.
Similarly, if we select click and select more than one bar on our bar chart (you can do this by holding down the CTRL key while clicking) our measure will figure out the MAX of just the selected data.
Here’s an example with Espresso and Latte selected.
If you want the MAX measure to always stay at 18 (or whatever the max is in the data you are using) we actually have to tell our DAX to ignore any data selections (like clicking bars on a bar chart, or using a slicer). You can learn how to do that using the ALL function in conjunction with the CALCULATE function.
It’s not hard, and we walk you through it with those two posts, so it’s easy to understand.
Now you know how to figure out the MAX of something.
Take care everyone,
Joe.