Power BI DAX: SUMX

The SUMX function in DAX is very similar to the SUM function (makes sense, right?) but with 1 key difference
We’re going to use a very simple dataset to demonstrate how the SUMX function works.
If you’d like to use the same data that I do in the below video, here is the data file you can connect to Power BI Desktop:

Video Post:
Written Post:
The SUMX function sums data, much like the SUM function does, but there is one crucial difference. While SUM adds up all the numbers in a column (click here for the SUM lesson), SUMX adds numbers in a row in that column.
Since there is usually only one number (or one piece of data) in a row, that explanation may sound strange. Let’s explain it a bit better with an example.
Open up Power BI Desktop and connect the above linked Excel file to it.
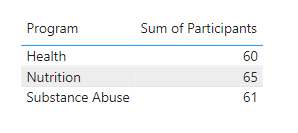
Now we’re going to make a simple table with our “Program” and “Participants” columns, and we’re going to turn off our Totals row (you can find the option to turn that off in the Totals section of the Formatting options in the Visualization Pane.
Let’s try creating a SUMX calculation on that Participants column.
Click on “New Measure” in the ribbon, or right-click on the data in the Data Pane and we’ll write DAX that looks like this:
SUMX PARTICIPANTS =
SUMX(Data, Data[Participants])
Our DAX measure starts with the name, the uses the SUMX function. SUMX functions are built a little bit differently than SUM functions in that we have to indicate what table our data is in (in our case, it’s in a table called “Data”), and then what column we want to perform SUMX on.
When we add this new “SUMX PARTICIPANTS” measure to our table, we get this:
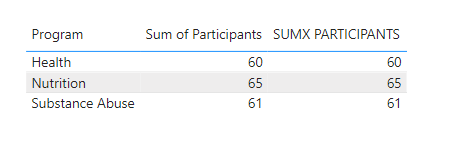
The SUMX measure is summing the value in each row of our Participants column.
This may not seem like it would be particularly useful, as our Participants column already has the same data, so let’s explore how it CAN be useful.
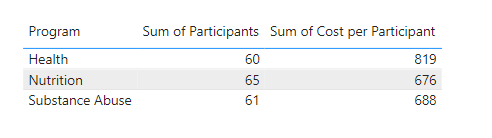
Let’s adjust our table so it has our Program, Participants, and Cost per Participants columns in it:
What we’d like to do is figure out the overall cost of each program by multiplying the number of participants by the cost per participant.
We’ll write a DAX measure that looks like this:
SUMX OVERALL COST =
SUMX(Data, Data[Participants]) *
SUMX(Data, Data[Cost per Participant])
SUMX(Data, Data[Cost per Participant])
This measure is multiplying the number of participants by the cost per participant (which is different for each program). Let’s add it to our table and see what we get.
We get the product of our multiplication calculation for each row of our table. We don’t have to make a column in our data source that figures this out for us… we can get DAX to do it for us.
The big advantage to doing this kind of calculation with a DAX measure instead of a column is that it doesn’t add to your data model. If we had a data set with thousands (or hundreds of thousands) of rows, having a column with this calculation figured out would make our data model a bunch larger.
The DAX measure on the other hand, exists virtually, and calculates the product for us WHEN we add it to a visual like this table, but otherwise just sort of sits there until needed.
Let me know in the comments below if you have a question about the SUMX function.
Take care everyone,
Joe.