If you’re a parent, or know a parent (or even if you don’t) you have probably heard of the concept of giving kids “free play” time. This is unstructured play with no rules (well, within reason… like burning down the house isn’t an option) so kids can explore toys or games or anything in a way that interests them.
The UNICEF website actually has a great description of this (and the benefits) so I’ll quote them here:
Sometimes it’s good for children to play alone or independently because they can be more creative when they are playing by themselves.
When a child is playing alone, they are engaging themselves, using their imagination and from very early childhood they are being independent.
Building independence at a young age is beneficial later in life.
Free play is also important for learning problem solving skills. They can try to solve a problem or come up with a solution on their own while playing.
They need to express their own way of thinking. Those skills develop when a child is playing independently.

It’s not just a good practice for kids, but for grown-ups too.
Google is (was?) famous for a “20% Time Policy” where employees could spend part of their work time working on projects of THEIR choosing (or invention), and Gmail, Adsense, and Google News came out of it.
Pretty HUGE projects!
I’ve been using Power BI in some way just about every day for about 6 years now, and I can make many user-friendly charts in it using formatting and DAX and Power Query that NO ONE else has figured out yet. It’s a professional edge I have. Knowing how to make Power BI user friendly.
The ironic part of this is that this professional edge I have with the program is due to me being unprofessional.

You see, when I’m getting tired of working on something, and when I don’t have the time to go for a walk or a bike ride, or get my paddle board out on Lake Ontario (weather permitting) my preferred way of taking a break or procrastinating for a bit is just to play in Power BI.
Most of the time I have NO objective to this play. I get some data, and I start testing weird things like extreme formatting settings, or programming DAX measures so they are different EVERY time a chart loads. Sometimes I DO have an objective, like making animations that change as data changes, or randomizing the color of EVERY element of a chart (lines, bars, markers, labels, titles).
Most importantly, the results (or process) of this playing have NO Immediate Use. I do NOT know how I will use anything I figure out.
And that is the point.
When I do this, I have no parameters or restrictions or official goals. I can be as creative or as “stupid” as I want to be as I experiment to see how different formatting settings work with one another, or how different DAX statements can be hacked and built upon.
Have I used anything I’ve discovered while playing in “official” work?
All. The. Time.
I’ve lost count of the number of times clients have asked me “Is _____ possible in Power BI” and I’ve gotten to say “Not officially, but I have an idea… let me get back to you on that.” because something I’ve learned through play can be applicable to that situation.
I want YOU to PLAY with Power BI more!
The fact is that I have learned WAY more from *playing* in Power BI than I have learned from *official* training from Microsoft. ANYONE can use Power BI the way it was designed to be used… it takes someone with a sense of play and adventure to try to do unorthodox to see how far Power BI can be pushed.
I want you all to embrace that sense of play. You can’t break Power BI… push it to (and beyond) the limits.
I end all my training workshops with that tip (and a few others) to help them get awesome at Power BI. The love of experimentation and creativity will take you far.

What can I (or anyone who thinks a bit differently about how Power BI builds things) do in Power BI?
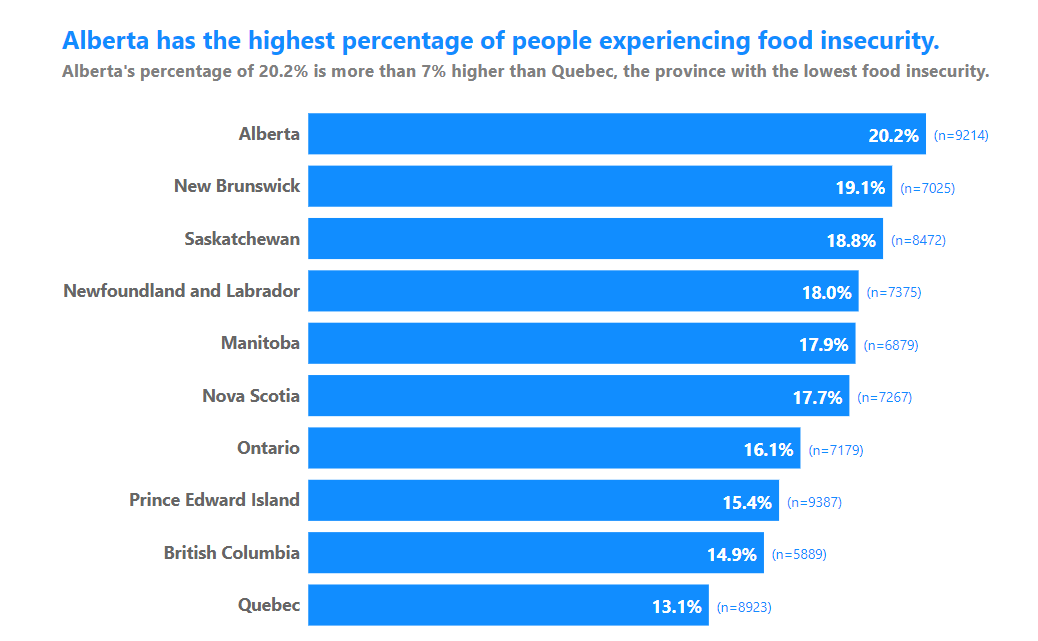
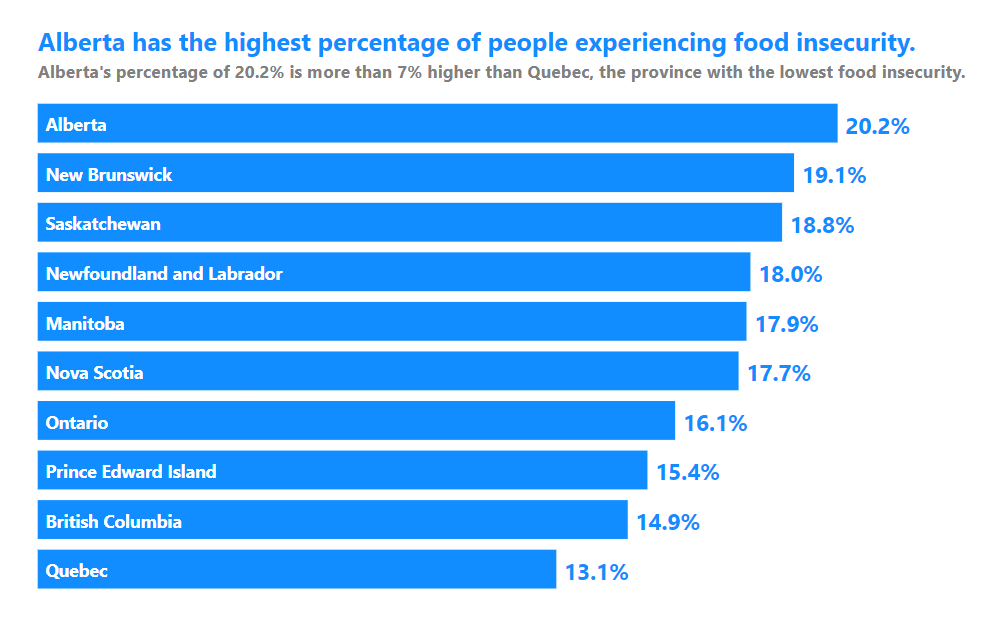
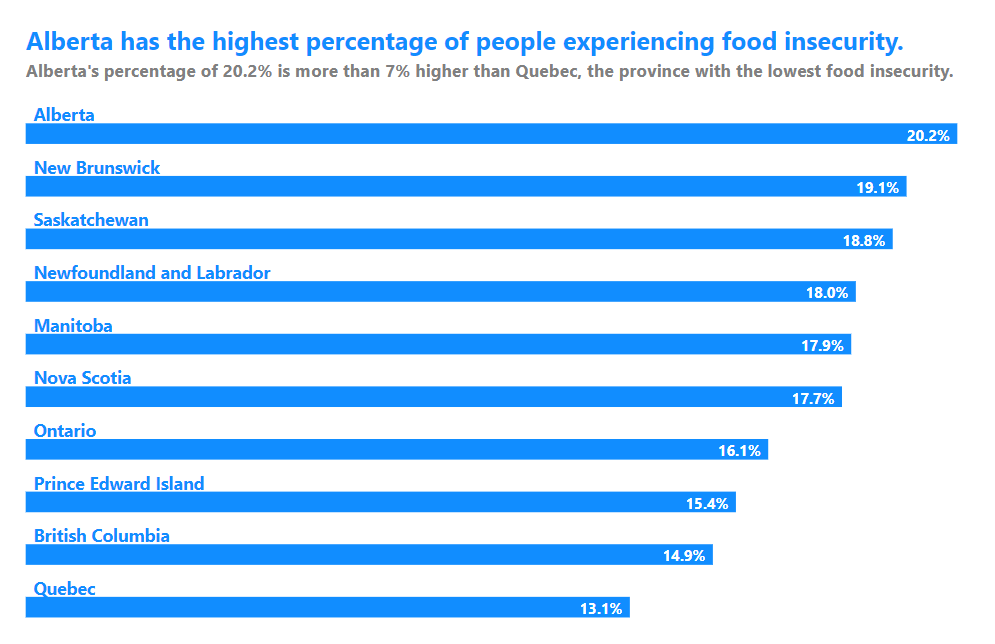
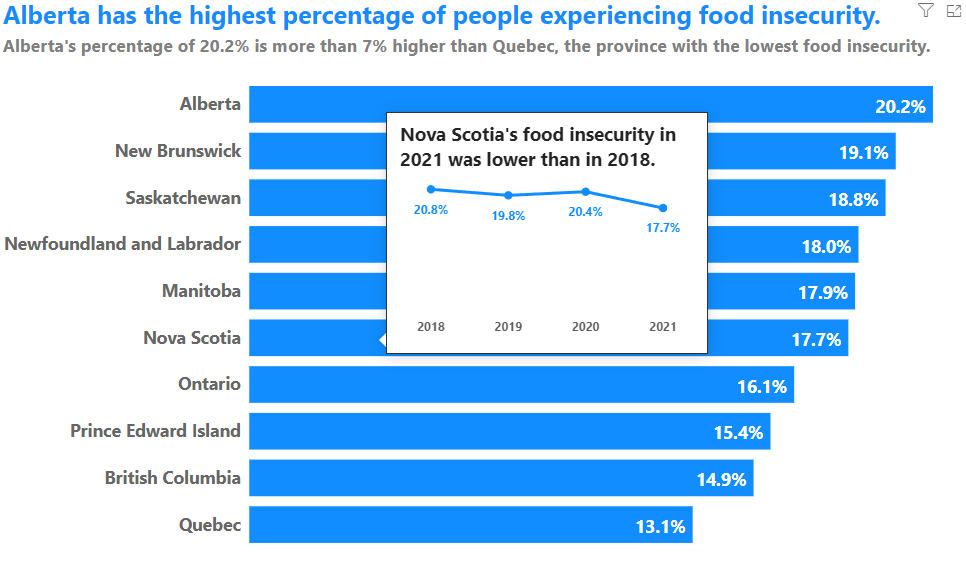
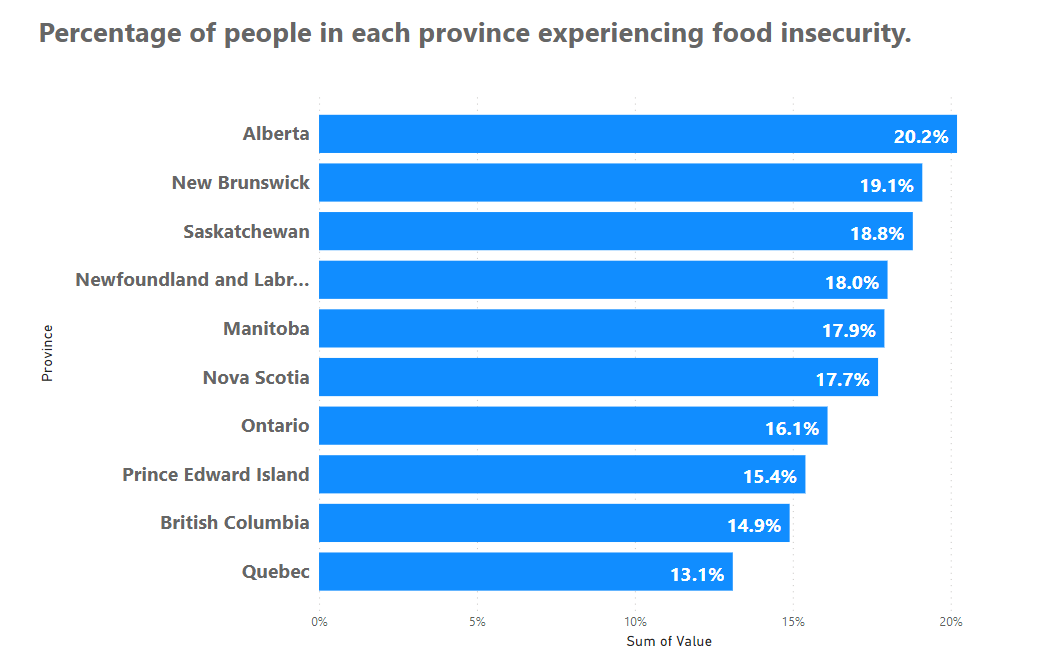
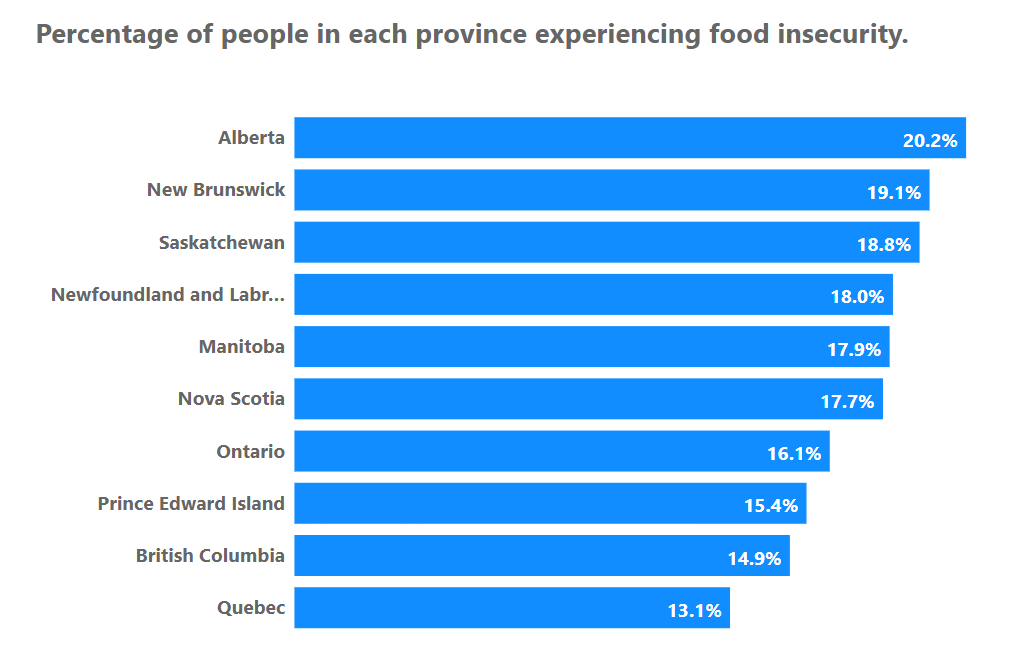
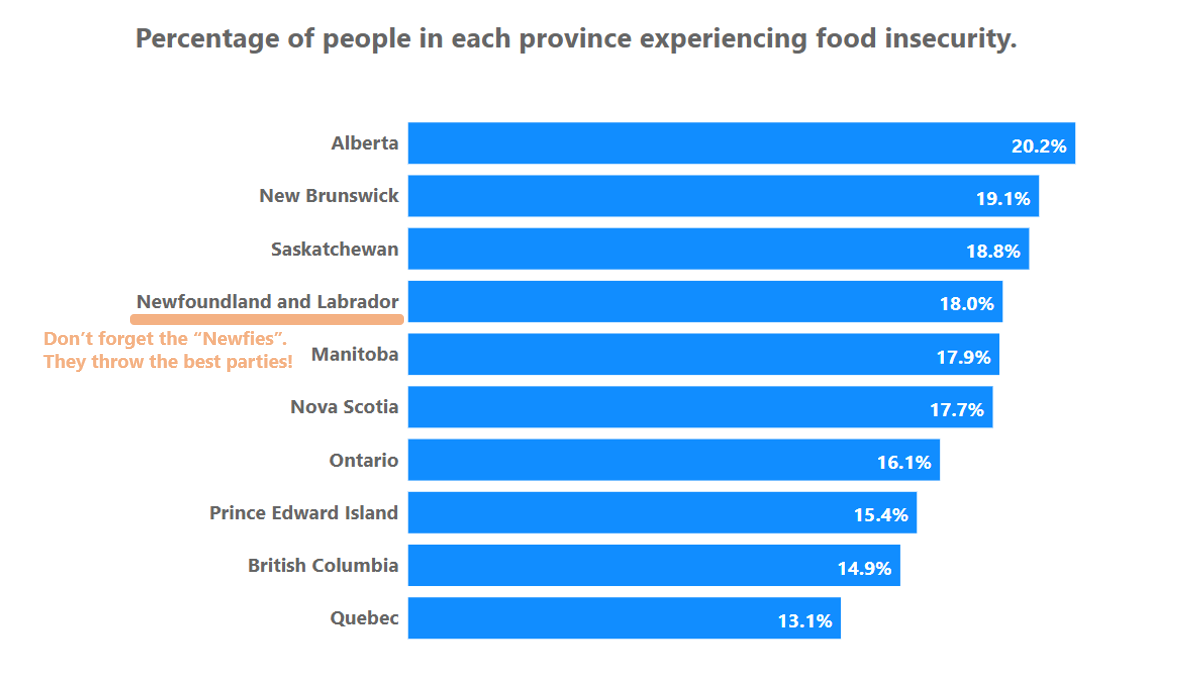
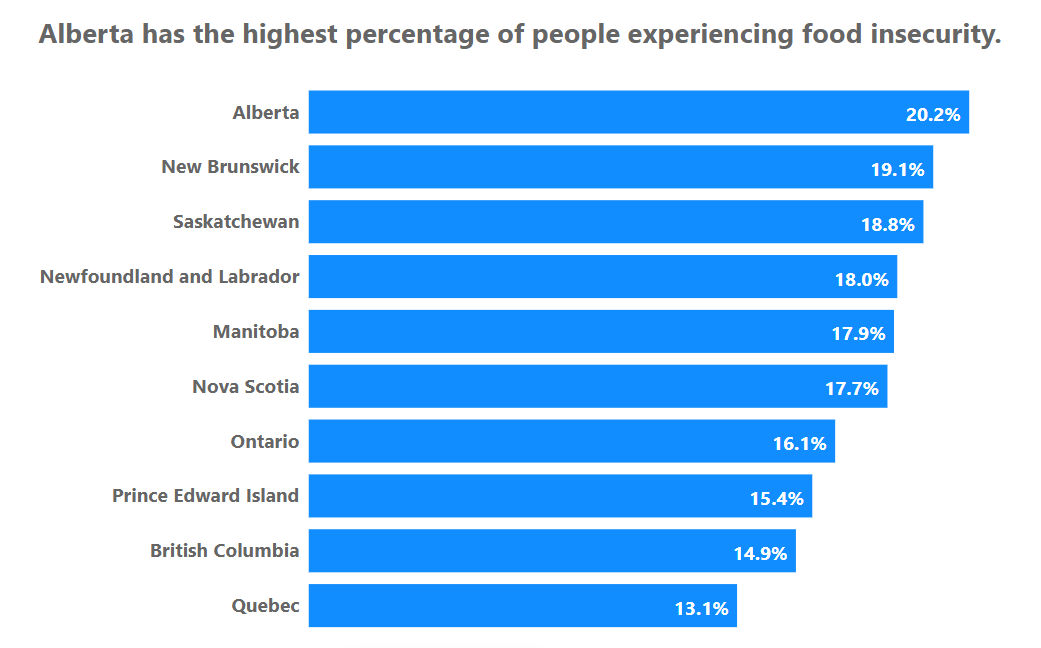
Below are 18 Chart types that Power BI doesn’t make without some play/creativity.
I figured all of these out by trying out weird things in Power BI, and made tutorials for them for Stephanie Evergreen’s Data Viz Academy.
If you’re into using Power BI or Excel or Tableau or R or Google Sheets to make engaging and effective data viz, go check out the Academy. You’ll love it. Enrollment opens up twice a year, so get on Stephanie’s VIP List to get notified when it opens in the future.
These are the Power BI charts I hacked using what I learned from the Academy. Stephanie taught me how to think differently in Excel (and that it’s beneficial to PLAY in software) and I use that now to make Power BI do things it’s not supposed to do.


Get out there and PLAY. You never know what you may come up with. Probably something revolutionary!
Stay tuned… this blog (as well as How To Use Power BI) will have lots more cool tips and tricks for Power BI, and a lot of them I figured out by PLAYING.